

Prediction of the drop hammer-derived tear toughness of pipeline steel production lines using literature data and production line data
-
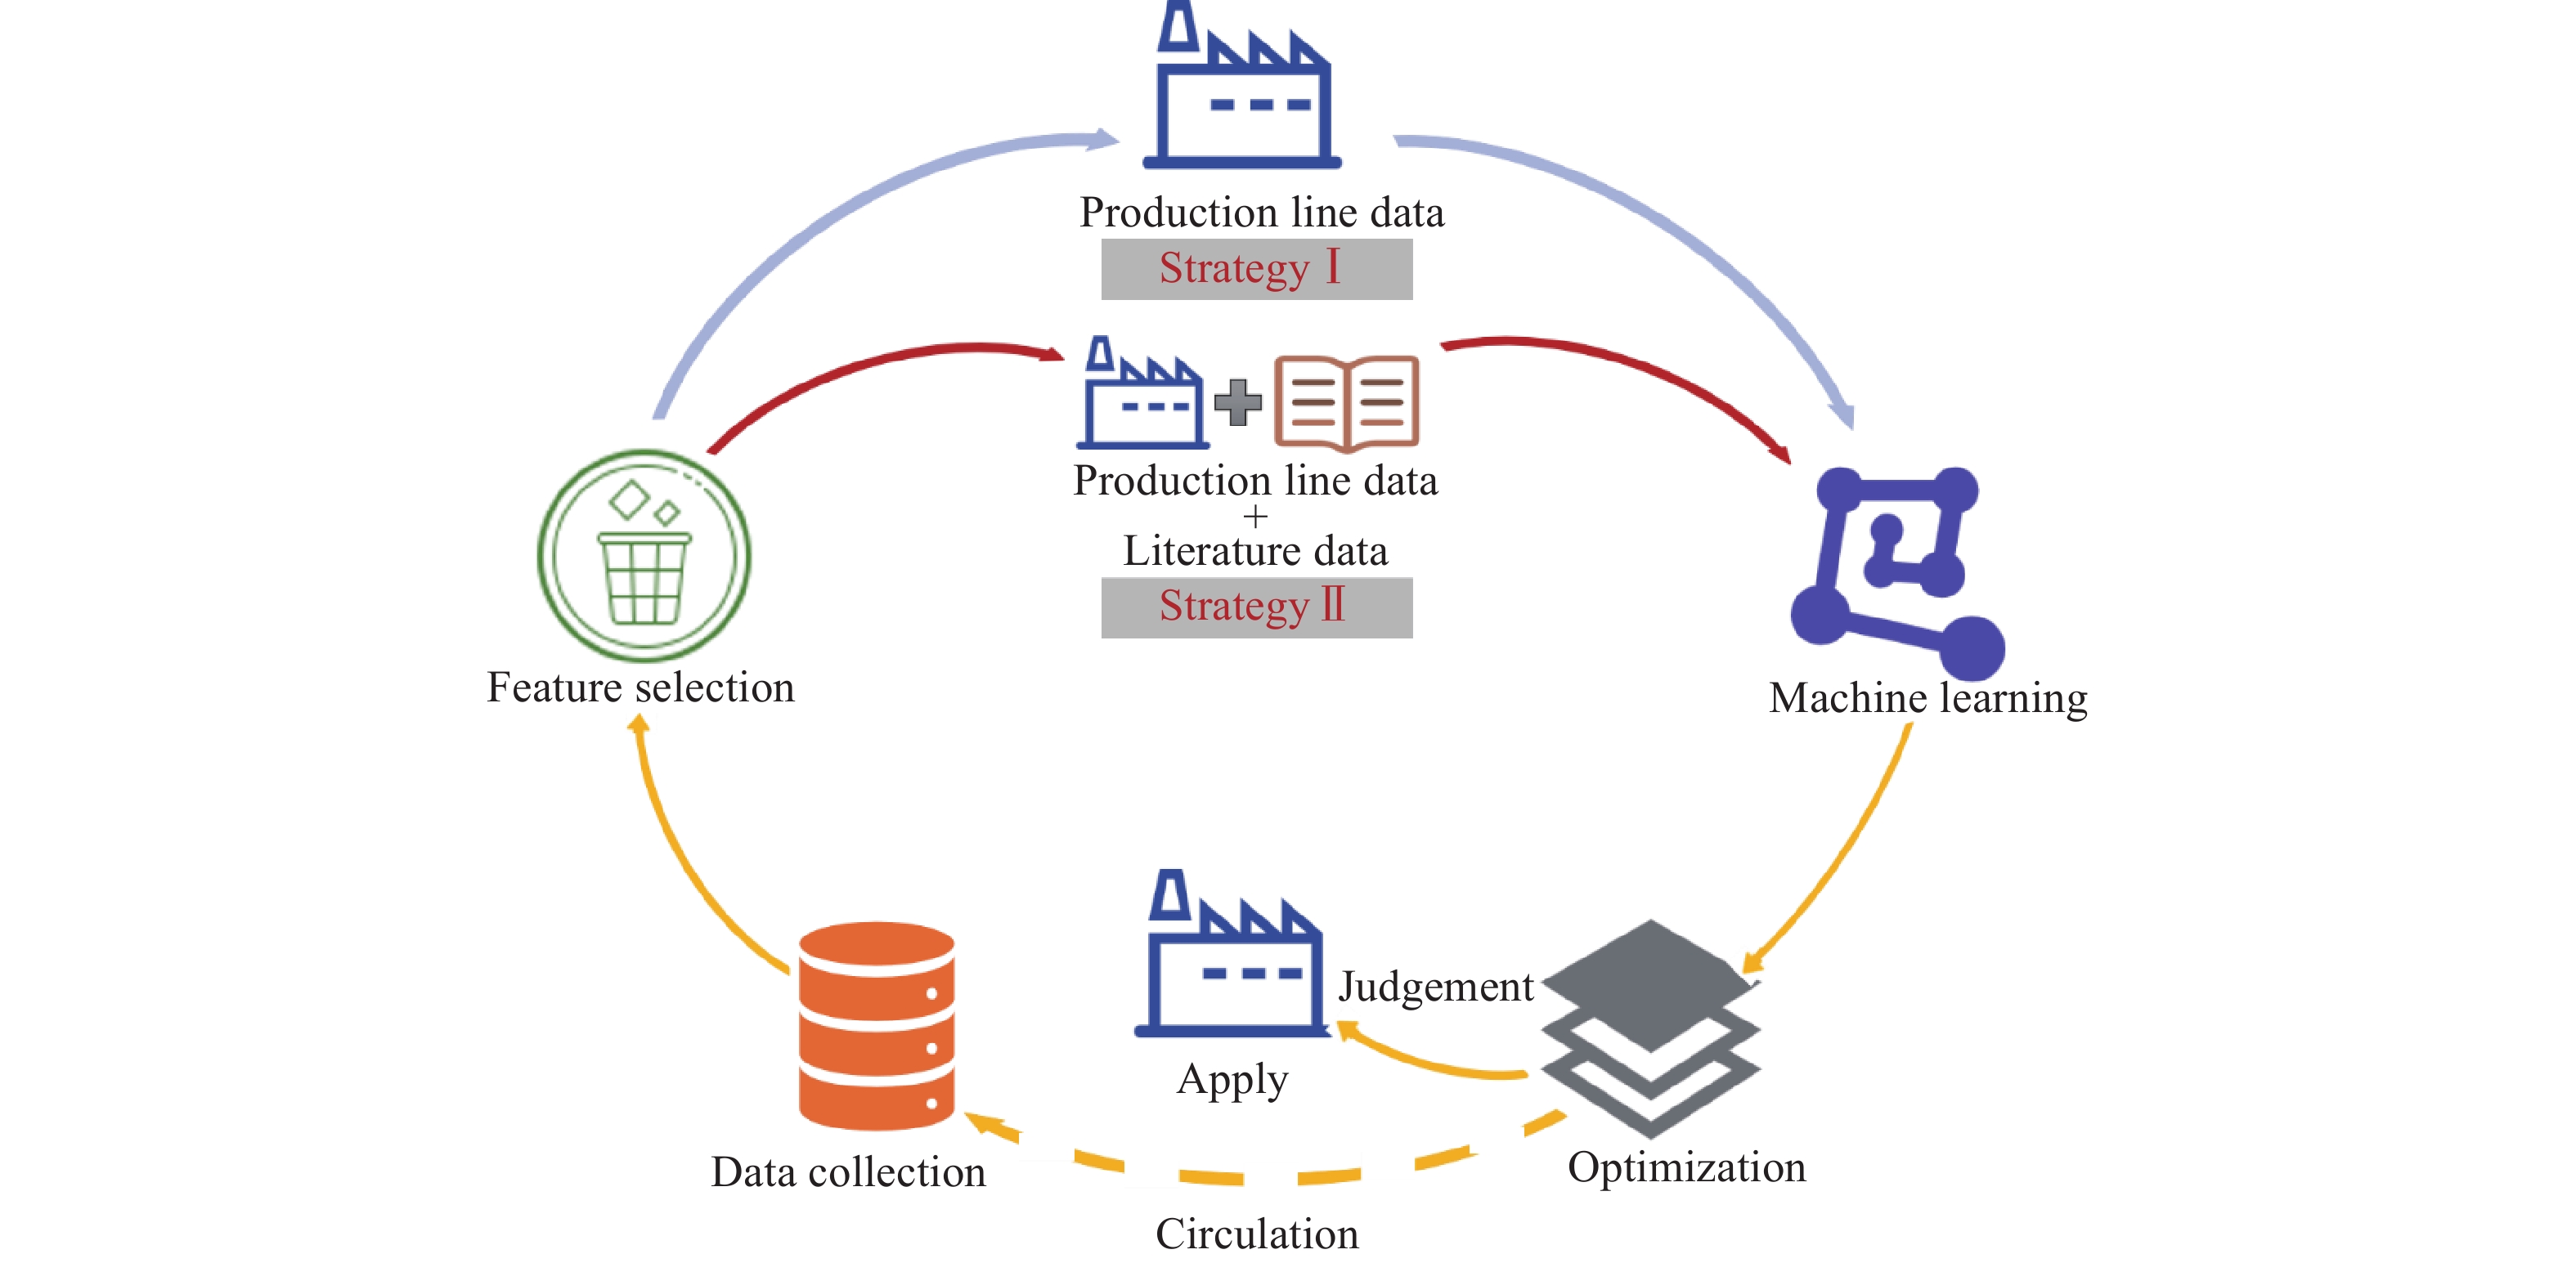
摘要: 管道運輸是當前長距離輸送石油、天然氣等能源最經濟的方式之一,具有優異的低溫韌性是保證管線鋼安全運輸的重要特征。落錘撕裂試驗(Drop weight tear testing,DWTT)是衡量管線鋼低溫韌性的最有效的方法。在目前的工作中,根據鋼廠提供的產線數據集和文獻收集的管線鋼數據集,建立了基于機器學習的DWTT剪切面積預測模型。基于純產線數據和文獻數據輔助的產線數據構造了兩種機器學習策略方案,測試了不同機器學習算法,效果最好的均是隨機森林模型,策略一的純產線數據模型的性能指標皮爾遜相關系數(PCC)為0.64,策略二的文獻數據輔助的產線數據模型的性能指標皮爾遜相關系數(PCC)為0.92,文獻數據的增加有效提高了DWTT剪切面積預測精度。機器學習技術為優化和預測DWTT剪切面積提供了一種新的思路。Abstract: Pipeline transportation is the most economical means of transporting oil, natural gas, and other energy sources over a long distance. With the increasingly harsh service environment of pipeline transportation, the requirements of pipeline steel in terms of strength, hydrogen-induced fracture resistance, and corrosion resistance have increased. In areas such as plateaus or deep seas, excellent low-temperature toughness is important to ensure the safe transportation of pipeline steel. Drop weight tear testing is one of the most effective methods for measuring the low-temperature toughness of pipeline steel. The test involves large specimens with full wall thickness. Through the characterization of the ductile–brittle shear area and ligament width of the sample, the toughness and tear resistance of pipeline steel can be better reflected. However, the drop weight tear test is difficult, time-consuming, and laborious, and it consumes a large amount of experimental resources. In this work, a machine learning-based model for predicting the drop weight tear test-derived shear area was established according to production line datasets provided by steel mills and pipeline steel datasets collected from the literature. Different machine learning algorithms were tested using the two datasets. The best models were random forest models. Strategy I included only production line datasets, and the Pearson correlation coefficient (PCC), which is the performance index, predicted by the machine learning model was 0.64. Strategy II involved literature data and production line data, and the PCC predicted by the machine learning model was 0.92. The consideration of literature data effectively improved the prediction accuracy of the drop weight tear test shear area. Moreover, in strategy II, to avoid the overfitting of the machine learning model, a feature screening technique was adopted. Finally, a genetic programming-based symbolic regression approach was developed to establish a formula describing the relationship between the selected features and the target shear area data. The PCC of the precision of this formula was 0.83, which indicates that the formula can be used to estimate the drop weight tear test-derived parameters of pipeline steel. The machine learning technology provides a new method for optimizing and predicting the drop weight tear test-derived shear area of pipeline steel. Moreover, the combination of production line data and literature data remarkably improved the accuracy of the machine learning model, which also allows for the prediction of other material production line data via machine learning techniques.
-
Key words:
- pipeline steel /
- drop weight tear testing /
- machine learning /
- data-driven design /
- symbolic regression
-
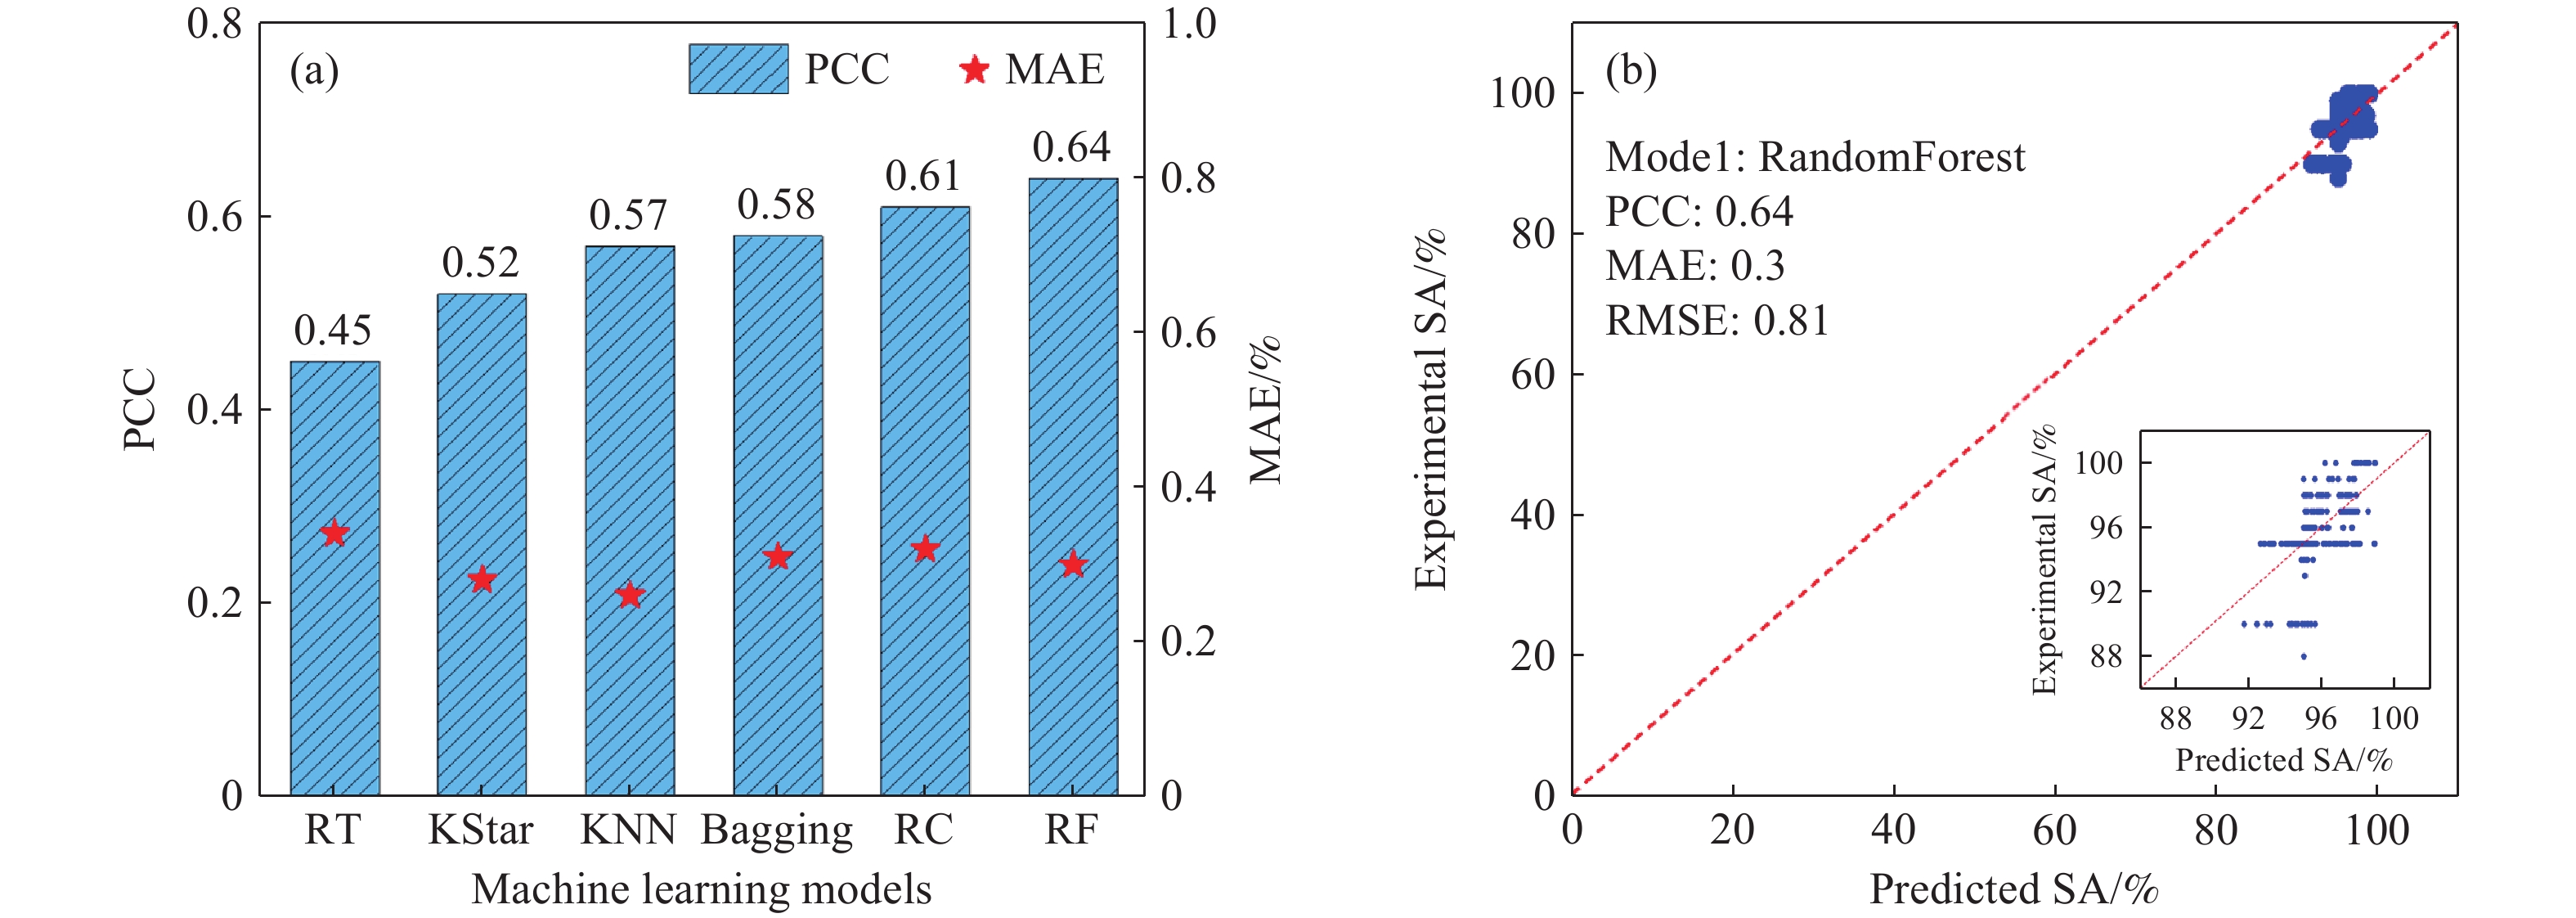
圖 2 產線數據的機器學習模型結果. (a)6種機器學習模型在產線數據上的皮爾遜相關系數(PCC)和平均絕對誤差(MAE)值;(b)實驗值與RF模型預測值的比較(所有模型均通過10折交叉驗證進行評估)
Figure 2. Machine learning (ML) model results for production line data: (a) pearson correlation coefficient (PCC) and mean absolute error (MAE) values of six ML models on production line data; (b) comparison between the experimental values and the predicted values of the RF model (All models were evaluated with 10-fold cross-validation)
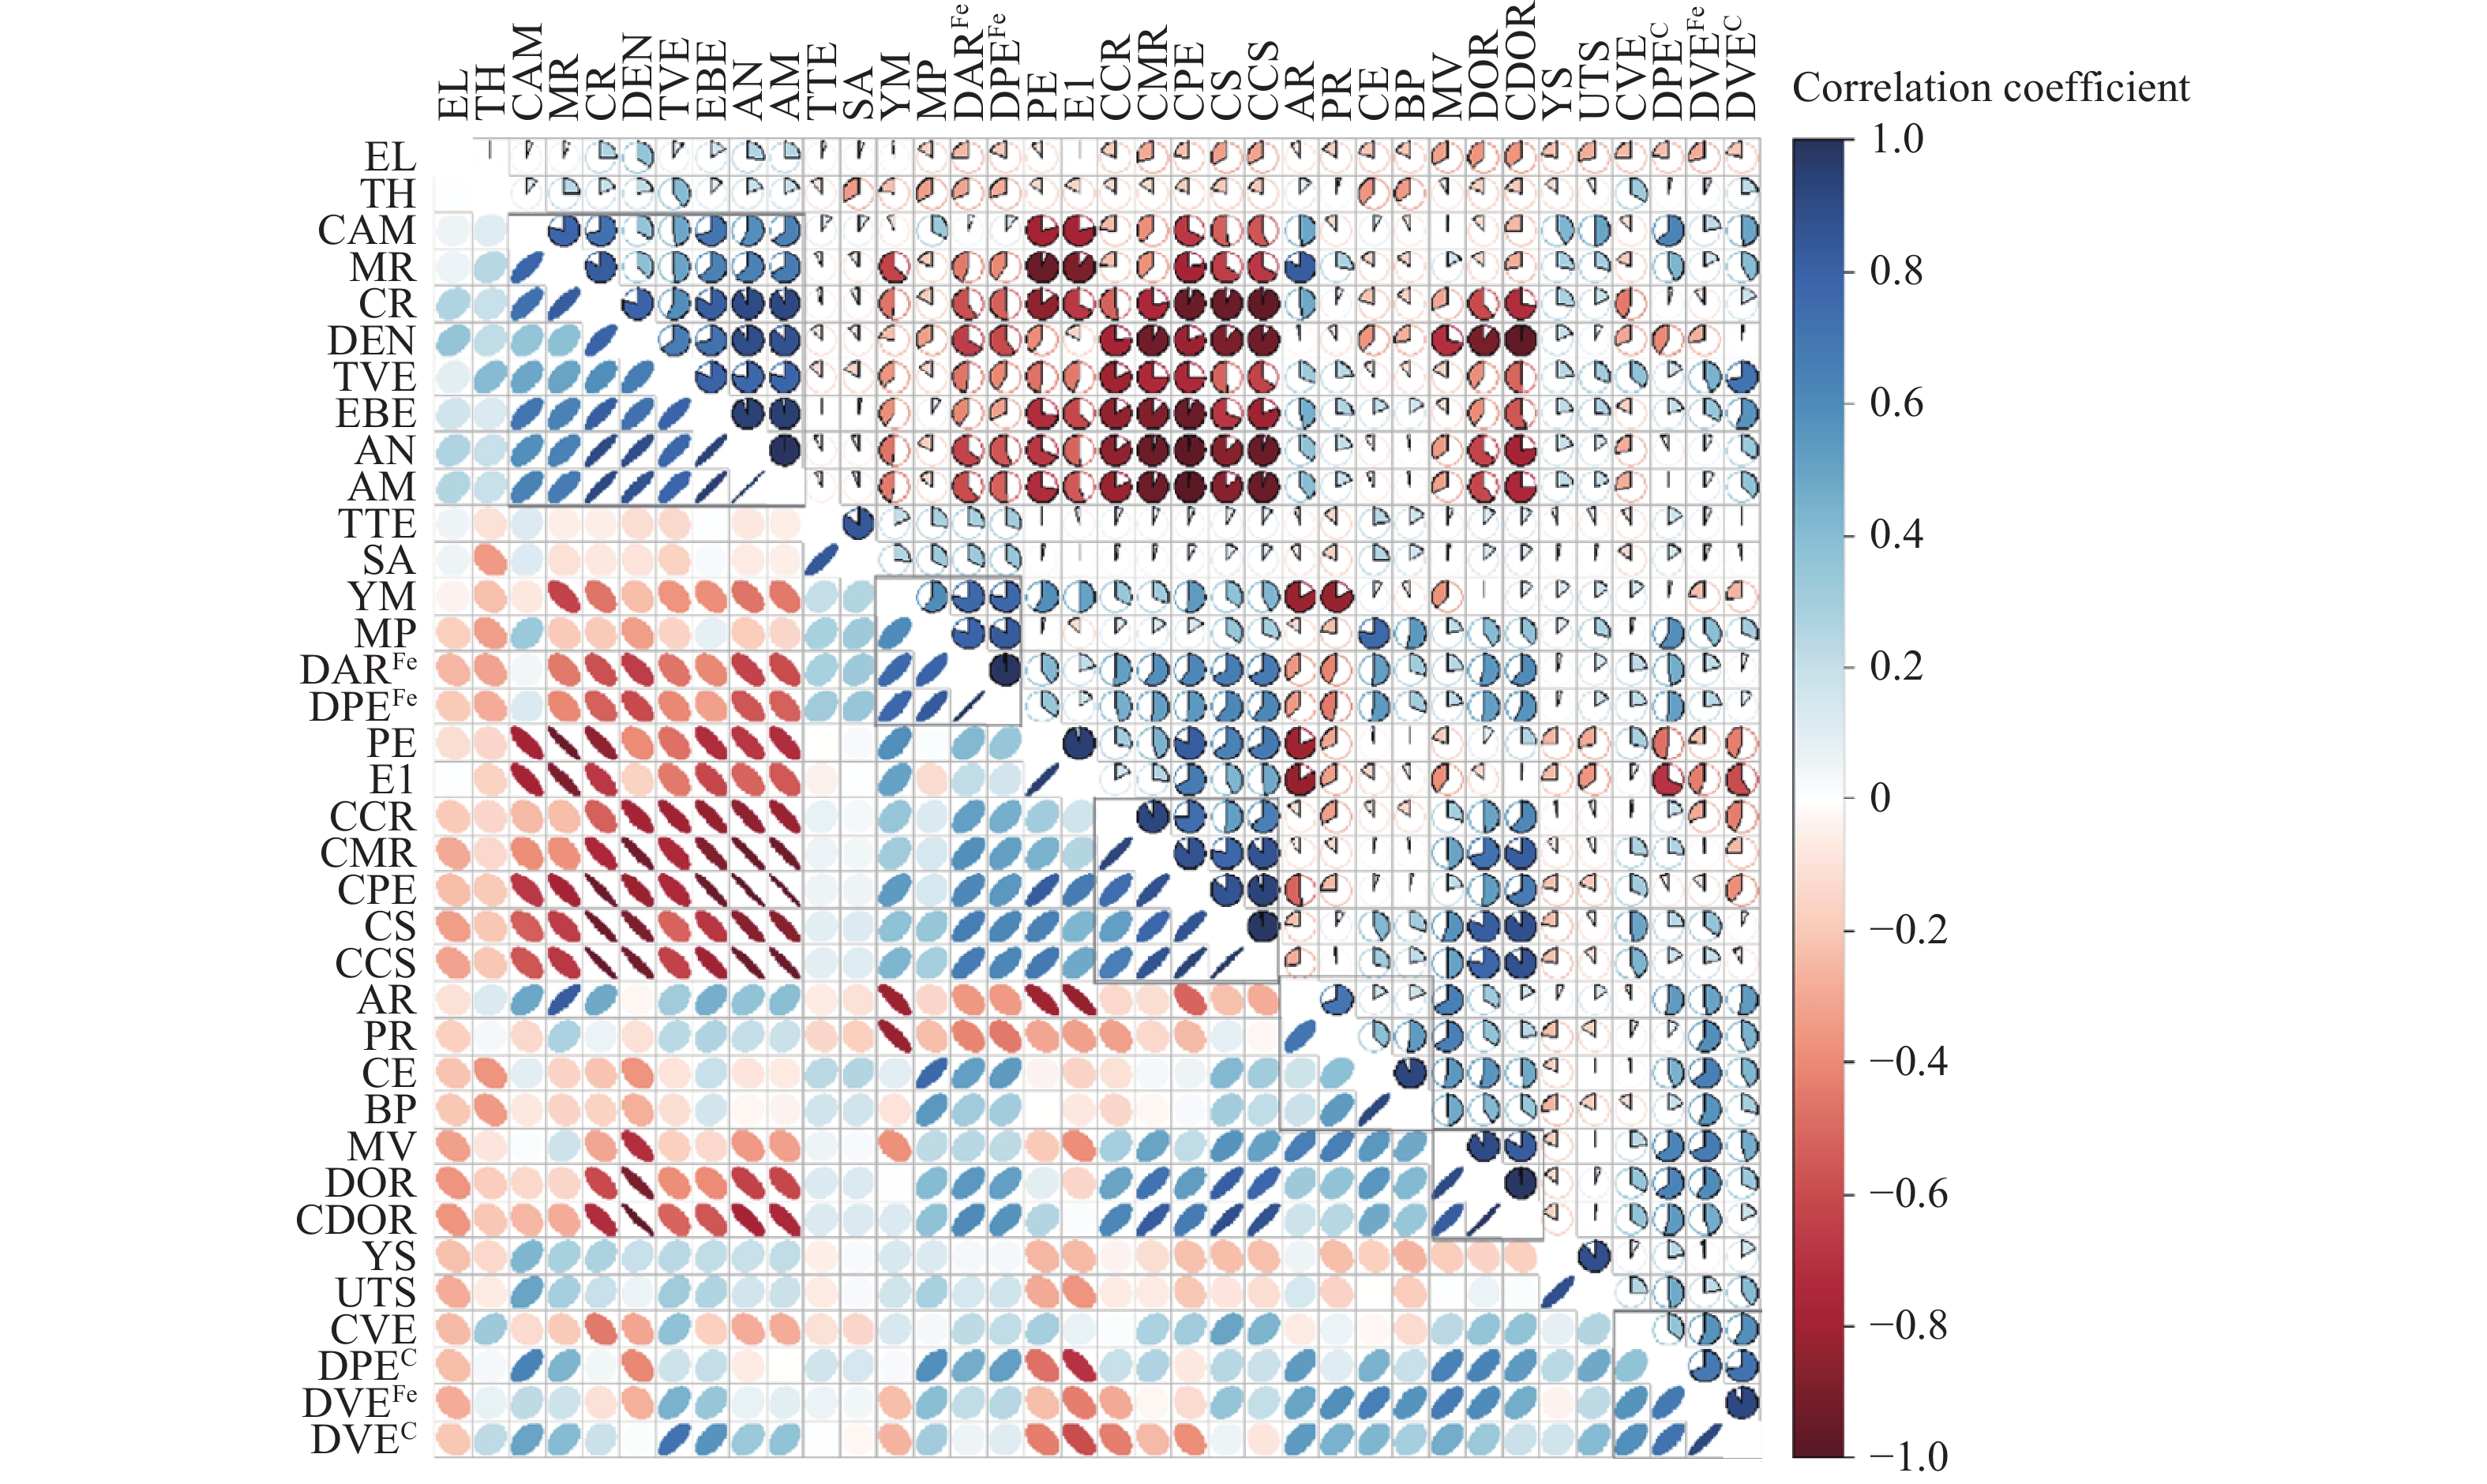
圖 3 DWTT 36個特征的Pearson相關系數圖(在特征集的相關系數矩陣中,顏色越深,相關性越高)
Figure 3. Pearson correlation coefficient diagram of 36 features of DWTT (In the correlation coefficient matrix of the feature set, the deeper the color, the higher the correlation)
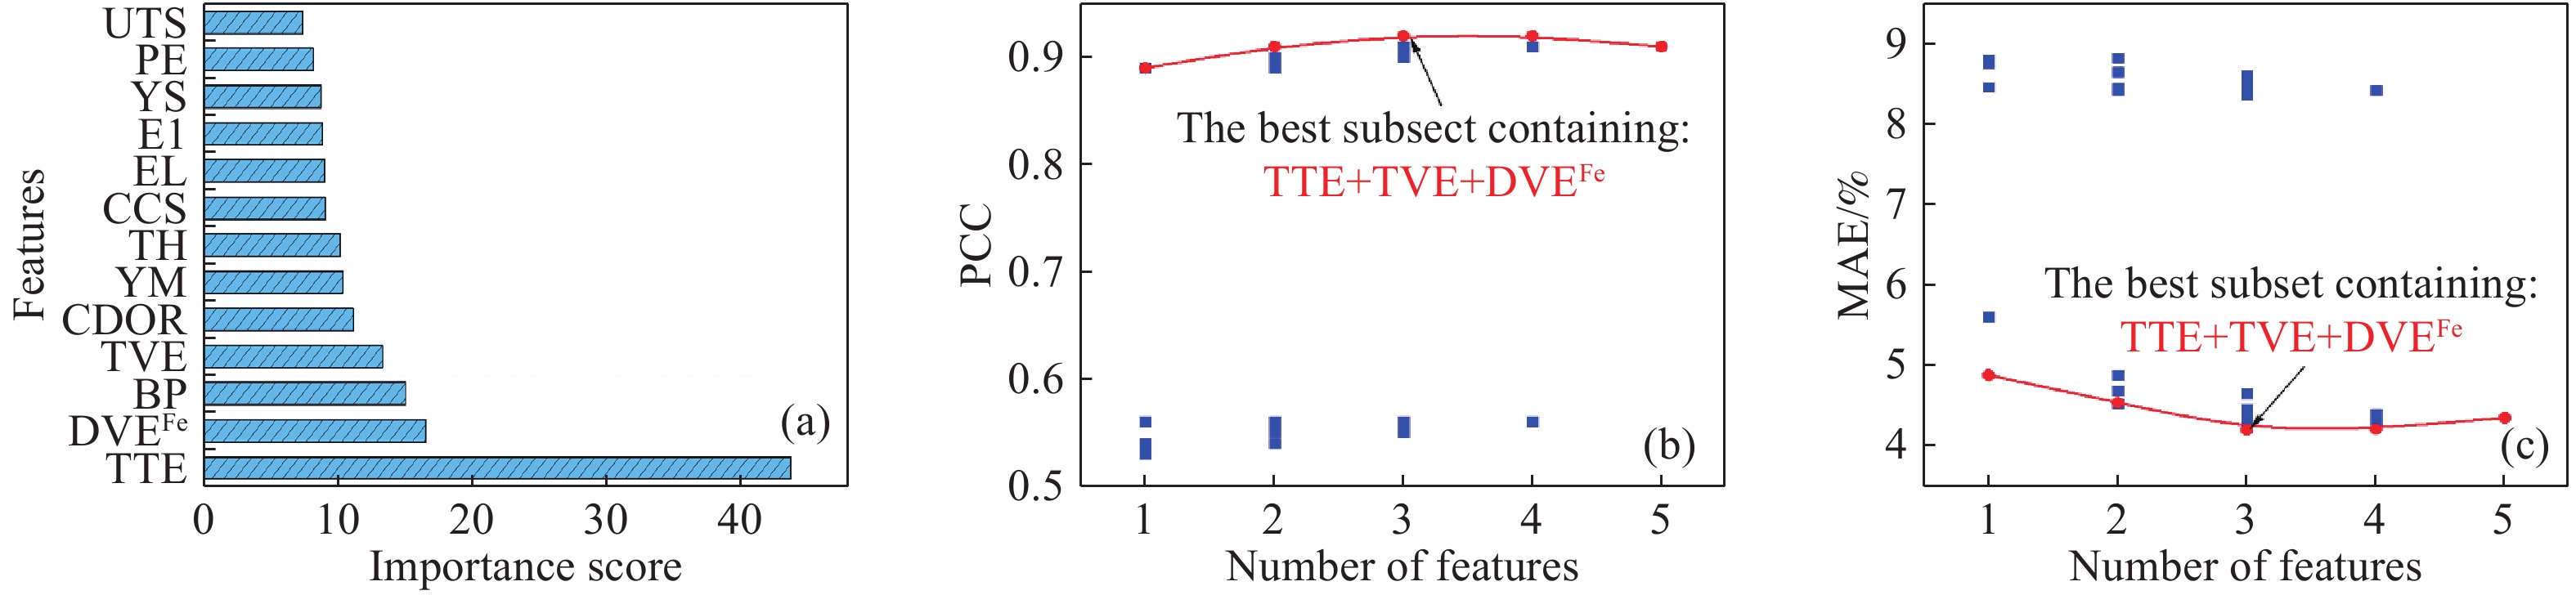
圖 4 管線鋼DWTT的特征篩選過程. (a)13個特征子集的平均重要性得分按升序排列;每個可能的特征子集RF模型的(b)皮爾遜相關系數(PCC)和(c)平均絕對誤差(MAE)值分布
Figure 4. Feature screening process of pipeline steel DWTT: (a) the average importance scores of 13 feature subsets are ranked in ascending order; the distribution of (b) pearson correlation coefficient (PCC) and (c) mean absolute error (MAE) values for each possible feature subset RF model
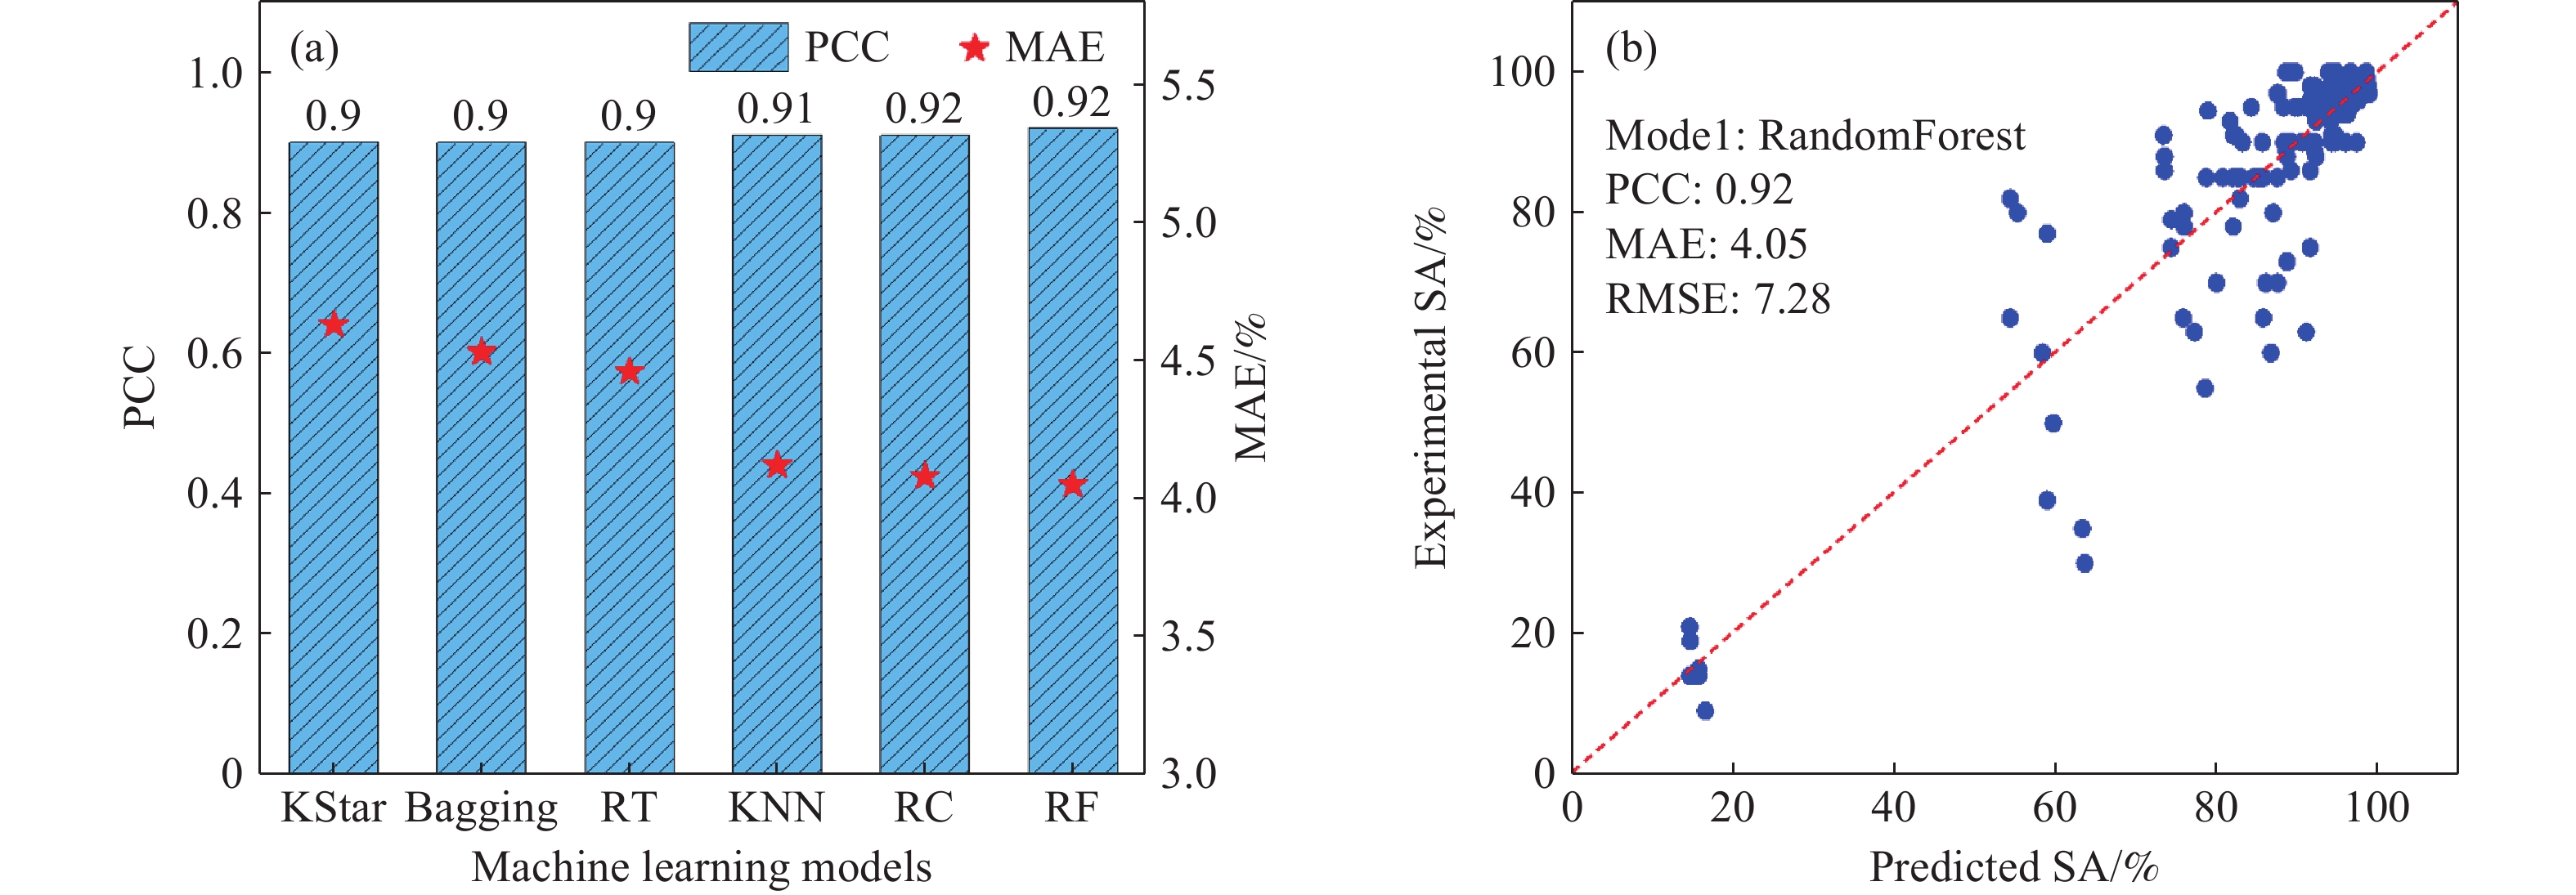
圖 5 文獻數據輔助的產線數據機器學習模型結果. (a)6種機器學習模型在文獻數據輔助的產線數據集上的皮爾遜相關系數(PCC)和平均絕對誤差(MAE);(b)實驗值與RF模型預測值的比較(所有模型均通過10折交叉驗證進行評估)
Figure 5. Results of the machine learning model on the combination of literature data and production line data: (a) pearson correlation coefficient (PCC) and mean absolute error (MAE) of six machine learning models on the combination of literature data and production line data; (b) comparison between the experimental and predicted values of the RF model (All models were evaluated with 10-fold cross-validation)
表 1 DWTT產線數據集中27個量
Table 1. Twenty-seven values in the DWTT production line dataset
Input/output Abb. Description Max Min Mean Inputs Fe Mass fraction of iron/% 97.952 97.640 97.803 C Mass fraction of carbon/% 0.090 0.050 0.063 Si Mass fraction of silicon/% 0.250 0.150 0.204 Mn Mass fraction of manganese/% 1.700 1.550 1.618 P Mass fraction of phosphorus/% 0.018 0.008 0.013 S Mass fraction of sulfur/% 0.003 0.001 0.002 Ni Mass fraction of nickel/% 0.020 0.000 0.007 Cr Mass fraction of chromium/% 0.220 0.018 0.123 Mo Mass fraction of molybdenum/% 0.090 0.050 0.069 Ti Mass fraction of titanium/% 0.017 0.008 0.012 Cu Mass fraction of copper/% 0.024 0.000 0.010 V Mass fraction of vanadium/% 0.016 0.000 0.002 Al Mass fraction of aluminum/% 0.044 0.016 0.030 N Mass fraction of nitrogen/% 0.008 0.001 0.004 Nb Mass fraction of niobium/% 0.050 0.030 0.039 B Mass fraction of boron/% 0.0003 0.0001 0.0001 Ceq Carbon equivalent 0.404 0.339 0.374 TH Thickness/mm 18 12 16.838 HV Vickers hardness 268 169 200.575 UTS Tensile strength/MPa 746 493 613.817 YS Yield strength/MPa 638 400 535.162 EL Elongation/% 50 20 41.465 YR Yield strength to tensile strength ratio 0.96 0.68 0.872 ST Secondary rolling temperature/°C 1079 654 898.165 FT Final rolling temperature/°C 886 666 837.054 TTE Test temperature/°C ?15 ?20 ?15.441 Output SA Shear area/% 100 88 95.132  下載: 導出CSV
表 2 DWTT文獻數據集中20個量
Table 2. Twenty values in DWTT literature dataset
Input/output Abb. Description Max Min Mean Inputs Fe Mass fraction of iron/% 98.18 95.63 97.680 C Mass fraction of carbon/% 0.105 0.035 0.055 Si Mass fraction of silicon/% 0.40 0.00 0.237 Mn Mass fraction of manganese/% 1.94 1.10 1.657 P Mass fraction of phosphorus/% 0.016 0.00 0.007 S Mass fraction of sulfur/% 0.013 0.00 0.002 Ni Mass fraction of nickel/% 0.40 0.00 0.081 Cr Mass fraction of chromium/% 0.30 0.00 0.051 Mo Mass fraction of molybdenum/% 0.30 0.00 0.090 Ti Mass fraction of titanium/% 0.33 0.00 0.021 Cu Mass fraction of copper/% 0.30 0.00 0.050 V Mass fraction of vanadium/% 0.50 0.00 0.025 Al Mass fraction of aluminum/% 0.04 0.00 0.008 Nb Mass fraction of niobium/% 0.50 0.00 0.036 TH Thickness/mm 38.50 7.50 21.715 UTS Tensile strength/MPa 1023 540 649.327 YS Yield strength/MPa 951 469 559.944 EL Elongation/% 57 8 34.131 TTE Test temperature/°C 0 ?80 ?29.019 Output SA Shear area/% 100 9 80.014
下載: 導出CSV
表 3 原子特征列表
Table 3. List of atomic features
Abb. Description Formula References DPEFe PE difference (Fe-based) $\mathop { {\text{d} }A}\nolimits^K = \sqrt {\displaystyle\sum\nolimits_{i = 1}^n {\mathop a\nolimits_i \mathop {\left( {1 - \frac{ {\mathop A\nolimits_i } }{ {\mathop A\nolimits_k } } } \right)}\nolimits^2 } }$ [8,32–35] DPEC PE difference (C-based) DVEFe VE difference (Fe-based) DVEC VE difference (C-based) DARFe AR difference (Fe-based) CDOR Mean concentration of DOR ${\text{CA} } = \frac{ {\displaystyle\sum\nolimits_{i = 1}^n {\mathop a\nolimits_i \mathop A\nolimits_i } } }{ {\displaystyle\sum\nolimits_{i = 1}^n {\mathop a\nolimits_i \mathop { {\text{AN} } }\nolimits_i } } }$ CVE Mean concentration of VE CMR Mean concentration of MR CCS Mean concentration of CS CCR Mean concentration of CR CPE Mean concentration of PE CAM Mean concentration of AM EBE Electron binding energies AN Atomic number $A = \displaystyle\sum\limits_{i = 1}^n {\mathop a\nolimits_i \mathop A\nolimits_i }$ AM Atomic mass PR Poisson’s ratio MP Melting point YM Young’s modulus BP Boiling point NE Number of elements CE Cohesive energy DEN density E1 First ionization energy DOR Waber–Cromer pseudopotential radii TVE Valance electron MR Metallic radius CS Pettifor chemical scale CR Clementi’s atomic radii PE Pauling electronegativity AR Atomic radii MV Molar volume
下載: 導出CSV
www.77susu.com<span id="fpn9h"><noframes id="fpn9h"><span id="fpn9h"></span> <span id="fpn9h"><noframes id="fpn9h"> <th id="fpn9h"></th> <strike id="fpn9h"><noframes id="fpn9h"><strike id="fpn9h"></strike> <th id="fpn9h"><noframes id="fpn9h"> <span id="fpn9h"><video id="fpn9h"></video></span> <ruby id="fpn9h"></ruby> <strike id="fpn9h"><noframes id="fpn9h"><span id="fpn9h"></span> -
參考文獻
[1] Yoo J Y, Ahn S S, Seo D H, et al. New development of high grade X80 to X120 pipeline steels. Mater Manuf Process, 2011, 26(1): 154 doi: 10.1080/10426910903202534 [2] Li H L, Ji L, Kang T W. Significant technical progress in the West-East Gas Pipeline Projects-Line One and Line Two. Nat Gas Ind, 2010, 30(4): 1李鶴林, 吉玲, 康田偉. 西氣東輸一、二線管道工程的幾項重大技術進步. 天然氣工業, 2010, 30(4):1 [3] Ji L K, Feng H, Zhang J M, et al. Strain-hardening behavior of high grade linepipe steel and its influence factors. J Xi’an Shiyou Univ (Nat Sci Ed), 2017, 32(3): 99吉玲康, 封輝, 張繼明, 等. 高鋼級管線鋼形變硬化行為及其影響因素分析. 西安石油大學學報(自然科學版), 2017, 32(3):99 [4] Ren Z P, Li D G, Li X W, et al. Construction and thinking of big data research and development platform for steel enterprises. J Iron Steel Res, 2021, 33(11): 1118 doi: 10.13228/j.boyuan.issn1001-0963.20200276任子平, 李德剛, 李曉偉, 等. 鋼鐵企業大數據研發平臺的建設與思考. 鋼鐵研究學報, 2021, 33(11):1118 doi: 10.13228/j.boyuan.issn1001-0963.20200276 [5] Wang G D, Liu Z Y, Zhang D H, et al. Transformation and development of materials science and technology and construction of iron and steel innovation infrastructure. J Iron Steel Res, 2021, 33(10): 1003 doi: 10.13228/j.boyuan.issn1001-0963.20210053王國棟, 劉振宇, 張殿華, 等. 材料科學技術轉型發展與鋼鐵創新基礎設施的建設. 鋼鐵研究學報, 2021, 33(10):1003 doi: 10.13228/j.boyuan.issn1001-0963.20210053 [6] Li X R, Ban X J, Yuan Z L, et al. Review on deep learning models for time series forecasting in industry. Chin J Eng, 2022, 44(4): 757李瀟睿, 班曉娟, 袁兆麟, 等. 工業場景下基于深度學習的時序預測方法及應用. 工程科學學報, 2022, 44(4):757 [7] Geng X X, Mao X P, Wu H H, et al. A hybrid machine learning model for predicting continuous cooling transformation diagrams in welding heat-affected zone of low alloy steels. J Mater Sci Technol, 2022, 107: 207 doi: 10.1016/j.jmst.2021.07.038 [8] Chen Y M, Wang S Z, Xiong J, et al. Identifying facile material descriptors for Charpy impact toughness in low-alloy steel via machine learning. J Mater Sci Technol, 2023, 132: 213 doi: 10.1016/j.jmst.2022.05.051 [9] Fürnkranz J, Gamberger D, Lavrač N. Foundations of Rule Learning. Lodon: Springer Science & Business Media, 2012 [10] Jiang X, Jia B R, Zhang G F, et al. A strategy combining machine learning and multiscale calculation to predict tensile strength for pearlitic steel wires with industrial data. Scripta Mater, 2020, 186: 272 doi: 10.1016/j.scriptamat.2020.03.064 [11] Zhao J H, Wang X Q, Kang J, et al. Crack propagation behavior during DWTT for X80 pipeline steel processed via ultra-fast cooling technique. Chin J Mater Res, 2017, 31(10): 728 doi: 10.11901/1005.3093.2016.055趙金華, 王學強, 康健, 等. 超快冷工藝下X80管線鋼的DWTT裂紋擴展行為. 材料研究學報, 2017, 31(10):728 doi: 10.11901/1005.3093.2016.055 [12] Jiang C L, Lin T, Zhu J Y. Research on low-temperature DWTT of 33 mm thick-wall X80 pipeline steel plate. Iron Steel Vanadium Titanium, 2019, 40(4): 158 doi: 10.7513/j.issn.1004-7638.2019.04.029蔣昌林, 林濤, 諸建陽. 33 mm壁厚X80管線鋼板的低溫落錘撕裂研究. 鋼鐵釩鈦, 2019, 40(4):158 doi: 10.7513/j.issn.1004-7638.2019.04.029 [13] Lu C J, Shao C J, Zhang L, et al. Experimental research on DWTT performance of high-strength pipeline steel. J Iron Steel Res, 2019, 31(12): 1065陸春潔, 邵春娟, 張磊, 等. 高強度管線鋼落錘撕裂性能的試驗. 鋼鐵研究學報, 2019, 31(12):1065 [14] Huo X X, Zhou P, Huang S W, et al. Effect of the microstructure on the DWTT properties of X70 pipeline steel. Shandong Metall, 2011, 33(5): 99 doi: 10.3969/j.issn.1004-4620.2011.05.036霍孝新, 周平, 黃少文, 等. X70管線鋼微觀組織結構對落錘性能的影響. 山東冶金, 2011, 33(5):99 doi: 10.3969/j.issn.1004-4620.2011.05.036 [15] Liu B, Wei F, Zhao Y, et al. Development and performance study of X80 Φ1422 mm × 38.5 mm thick wall SAWL pipe. Welded Pipe Tube, 2021, 44(1): 1劉斌, 韋奉, 趙勇, 等. X80鋼級Ф1422 mm×38.5 mm大壁厚直縫埋弧焊管的開發及性能研究. 5焊管, 2021, 44(1):1 [16] Su D X, Xu W C. Research on influence of specimen thickness and drop weight test method on X70 pipeline steel DWTT performance. Welded Pipe Tube, 2018, 41(7): 21蘇大雄, 徐惟誠. 試樣厚度及落錘試驗方式對X70 DWTT性能影響的研究. 焊管, 2018, 41(7):21 [17] Gao Y, Jiang J X, Zuo X R, et al. Microstructures and fracture behaviors in heavy thick multi-phase X80 pipeline steel. J Netshape Form Eng, 2018, 10(6): 43 doi: 10.3969/j.issn.1674-6457.2018.06.008高燕, 姜金星, 左秀榮, 等. 厚規格多相組織X80管線鋼組織控制與斷裂行為研究. 精密成形工程, 2018, 10(6):43 doi: 10.3969/j.issn.1674-6457.2018.06.008 [18] Agrawal A, Deshpande P D, Cecen A, et al. Exploration of data science techniques to predict fatigue strength of steel from composition and processing parameters. Integr Mater Manuf Innov, 2014, 3(1): 90 doi: 10.1186/2193-9772-3-8 [19] Strnadel B, Ferfecki P, ?idlík P. Statistical characteristics of fracture surfaces in high-strength steel drop weight tear test specimens. Eng Fract Mech, 2013, 112-113: 1 doi: 10.1016/j.engfracmech.2013.10.001 [20] Hwang B, Shin S Y, Lee S, et al. Effect of microstructure on drop weight tear properties and inverse fracture occurring in hammer impacted region of high toughness X70 pipeline steels. Mater Sci Technol, 2008, 24(8): 945 doi: 10.1179/174328406X148732 [21] Sha Q Y, Li D H. Microstructure, mechanical properties and hydrogen induced cracking susceptibility of X80 pipeline steel with reduced Mn content. Mater Sci Eng A, 2013, 585: 214 doi: 10.1016/j.msea.2013.07.055 [22] Hwang B, Kim Y G, Lee S, et al. Effective grain size and charpy impact properties of high-toughness X70 pipeline steels. Metall Mater Trans A, 2005, 36(8): 2107 doi: 10.1007/s11661-005-0331-9 [23] Zhang J M, Sun W H, Sun H. Mechanical properties and microstructure of X120 grade high strength pipeline steel. J Iron Steel Res Int, 2010, 17(10): 63 doi: 10.1016/S1006-706X(10)60185-9 [24] You Y, Shang C J, Nie W J, et al. Investigation on the microstructure and toughness of coarse grained heat affected zone in X-100 multi-phase pipeline steel with high Nb content. Mater Sci Eng A, 2012, 558: 692 doi: 10.1016/j.msea.2012.08.077 [25] Matrosov Y I, Bagmet O, Nosochenko A. Development of modern heavy plate steels for pipelines. Proceedings of the Materials Science Forum, 2007, 539-543: 4756 doi: 10.4028/www.scientific.net/MSF.539-543.4756 [26] Johnson J, Hudson M, Takahashi N, et al. Specification and manufacturing of pipes for the X100 operational trial // Proceedings of 2008 7th International Pipeline Conference. Calgary, 2009: 453 [27] Hillenbrand H G, Liessem A, Grimpe F, et al. Manufacturing of X100 pipes for the TAP project // Proceedings of the International Pipeline Conference. Calgary, 2006: 261 [28] Zha C H, Jiang Z H, Wang W J, et al. Research and development of heavy wall X80 transmission pipeline steel with high deformation characteristics for polar environments at Shougang steel // Proceedings of the International Pipeline Conference. Calgary, 2012: 249 [29] Aihara S, Lange H I, Misawa K, et al. Full-scale burst test of hydrogen gas X65 pipeline // Proceedings of 2010 8th International Pipeline Conference. Calgary, 2010: 415 [30] Jordan M I, Mitchell T M. Machine learning: Trends, perspectives, and prospects. Science, 2015, 349(6245): 255 doi: 10.1126/science.aaa8415 [31] Chai T, Draxler R. Root mean square error (RMSE) or mean absolute error (MAE)? –Arguments against avoiding RMSE in the literature. Geosci Model Dev, 2014, 7: 1247 doi: 10.5194/gmd-7-1247-2014 [32] Pauling L. The nature of the chemical bond. IV. The energy of single bonds and the relative electronegativity of atoms. J Am Chem Soc, 1932, 54(9): 3570 [33] Waber J, Cromer D T. Orbital radii of atoms and ions. J Chem Phys, 1965, 42(12): 4116 doi: 10.1063/1.1695904 [34] Clementi E, Raimondi D L. Atomic screening constants from SCF functions. J Chem Phys, 1963, 38(11): 2686 doi: 10.1063/1.1733573 [35] Rabe K M, Phillips J C, Villars P, et al. Global multinary structural chemistry of stable quasicrystals, high-TC ferroelectrics, and high-Tc superconductors. Phys Rev B Condens Matter, 1992, 45(14): 7650 doi: 10.1103/PhysRevB.45.7650 [36] Zhang Y, Wen C, Wang C X, et al. Phase prediction in high entropy alloys with a rational selection of materials descriptors and machine learning models. Acta Mater, 2020, 185: 528 doi: 10.1016/j.actamat.2019.11.067 [37] He J J, Li J J, Liu C B, et al. Machine learning identified materials descriptors for ferroelectricity. Acta Mater, 2021, 209: 116815 doi: 10.1016/j.actamat.2021.116815 [38] Romanski P, Kotthoff L, Kotthoff M L. Package ‘FSelector’ [J/OL]. Sciencepaper Online (2009-10-29) [2022-12-19]. https://citeseerx.ist.psu.edu/document?repid=rep1&type=pdf&doi=52ee687db3d94ec2143ab44021a303301ad133b1 [39] Chandrashekar G, Sahin F. A survey on feature selection methods. Comput Electr Eng, 2014, 40(1): 16 doi: 10.1016/j.compeleceng.2013.11.024 [40] James G, Witten D, Hastie T, et al. An Introduction to Statistical Learning. New York: springer, 2013 -

 點擊查看大圖
計量
- 文章訪問數: 297
- HTML全文瀏覽量: 118
- PDF下載量: 55
- 被引次數: 0
